Sketching a Polynomial Graph

To some people, sketching linear or quadratic equations appear to be a piece of cake, but when it comes to sketching polynomial graphs, we’re talking about “a whole nother” level. 

Today, we’ll be running through the process of sketching a polynomial division graph.

First, go ahead and familiarize yourself with the word “polynomial”. As a mathematical term, polynomial refers to an expression of more than two algebraic terms. 

Here comes the sketching procedure:

  1. Factor the polynomials
  2. Find Vertical Asymptotes
  3. Find Horizontal Asymptotes
  4. Solve for Y-intercept
  5. Solve for zeros

We will use the expression below as an exemplar. 

2x

Why Tan θ = sin θ / cos θ

Frequently in math, when it comes to trigonometry, a lot of people know that Tan θ = sin θ / cos θ, but do you actually know why this concept is logical?

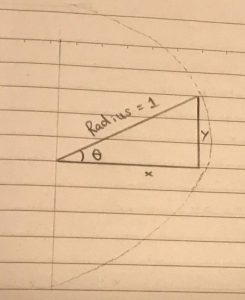
Let’s take a look at this triangle inside of the semi circle.

The triangle has a hypotenuse of the same length as that of the radius of the circle. We represent the opposite side of θ as y (the vertical axis) and the adjacent side as x (the horizontal axis). With that we can find cos θ and sin θ using x and y .

SOH CAH TOA

Sin θ = Opposite / Hypotenuse = y / 1 = y

Cos θ = Adjacent / Hypotenuse = x / 1 = x

Tan θ = Opposite / Adjacent = y / x = sin θ / cos θ


Advanced Placement Statistics (AP Stats)

AP Statistics is important not because you can take an exam and get credits for the university, but because of the effectiveness of it. Unlike geometry, algebra or trigonometry, you can use it in everyday life. You can use this skill to analyze statistics and predicting values. For example, you would use an equation that has two variables to plug in one value and predict another.